The Herculean task of assessing scientific productivity.

Evaluating a scientist, an institution or a country using the number and impact of their publications in the scientific community is a controversial and difficult issue to address. Bibliometric indices, with the H index in the lead, were coined to simplify and standardize this task, which may seem impossible a priori. These indices are also a useful tool to roughly assess and prioritize the impact of a certain pathogen on a particular field and in the scientific community. Recently, a group of CReSA researchers have published a paper in PLoS ONE where several bibliometric indices were used to measure the impact of pig pathogens. Furthermore, they have coined a new index named Dcos (Deciphering Citations Organized by Subject). Based on the H indices for a certain study area, the Dcos index measures the importance of the scientific contribution of a scientist or a research institution into a particular research field.
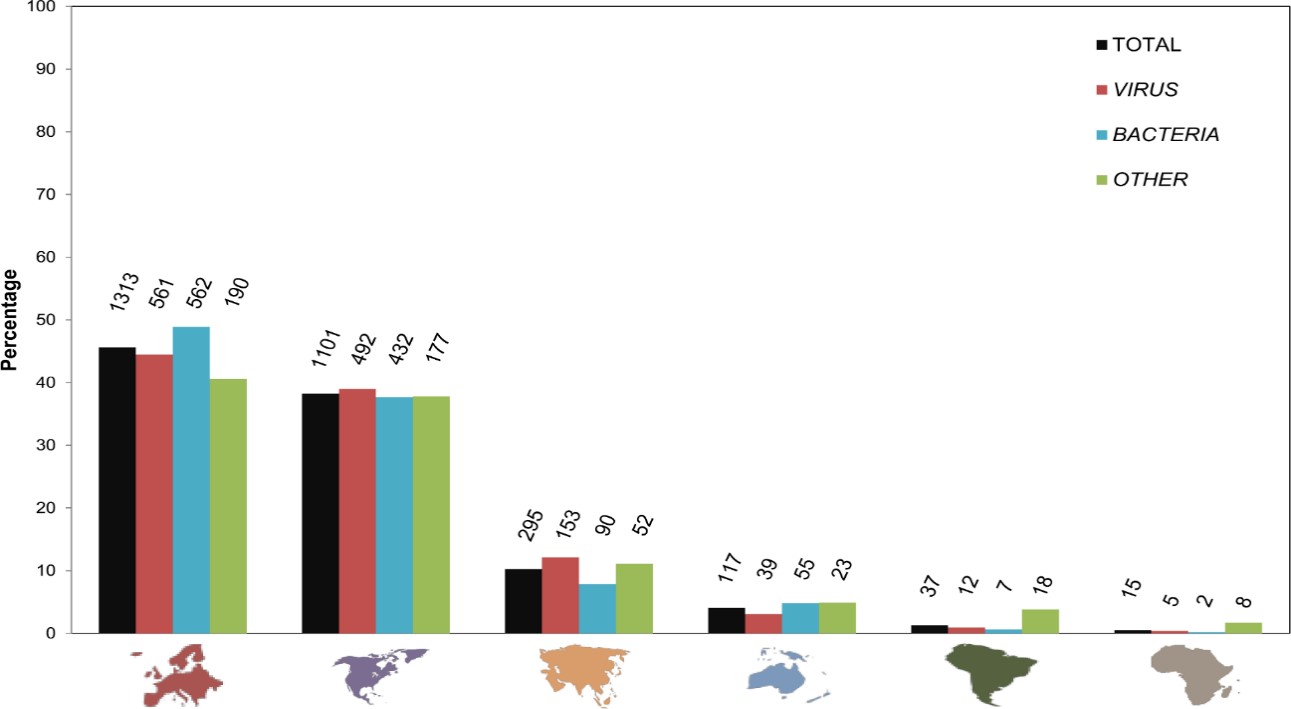
Continental distribution (percentage) of the papers included in the H indices cores belonging to the 137 pathogens affecting pig. Continental distribution (percentage) according to the first author origin for a total of 2878 papers (black), of which 1262 related to virus (red), 1148 on bacteria (blue) and 468 on other -helminth, protozoa, etc. (green). The absolute number of papers is located at the top of each bar.
Firstly, the H index scores for 137 pathogens affecting pig were determined. The scores were compared with other common indices that evaluate scientific productivity -indices A, G and HG, M quotient and G/H ratio -. This is the first time that different indices, other than the H index, were used to assess the impact of pathogens. Additionally, the temporal evolution of the 10 pathogens with the highest H indices and the possible events that may have affected this evolution were evaluated.
Secondly, the papers included in the H index cores of the 137 pathogens, about 3000, were reviewed in order to know the country of affiliation of the first author. Once grouped by continents, the vast majority originated in Europe and North-America, representing the 46% and 38% of the total, respectively. Spain, despite having a much lower R&D investment than other countries, stands in seventh place worldwide, third if we consider only the items related to virus. Furthermore, applying the new Dcos index it was observed that the studies conducted in CReSA have a great scientific impact, being the research cornerstone of swine pathology in Spain, holding almost one third of all Spanish articles included in the H indices cores.
…applying the new Dcos index it was observed that the studies conducted in CReSA have a major scientific impact.
The methodology used and the results obtained in the study are widely discussed in the article. The main conclusion indicates that the score and evolution of the indices are strongly influenced by the geographical distribution of the pathogens, its taxonomy, the importance of pig production, the level of investment in R&D in different countries, as well as the emergence of epidemic outbreaks or episodes in humans when it comes to zoonotic agents.
BIBLIOMETRIC INDICES & PRACTICAL EXAMPLE. DATA FROM 2015.
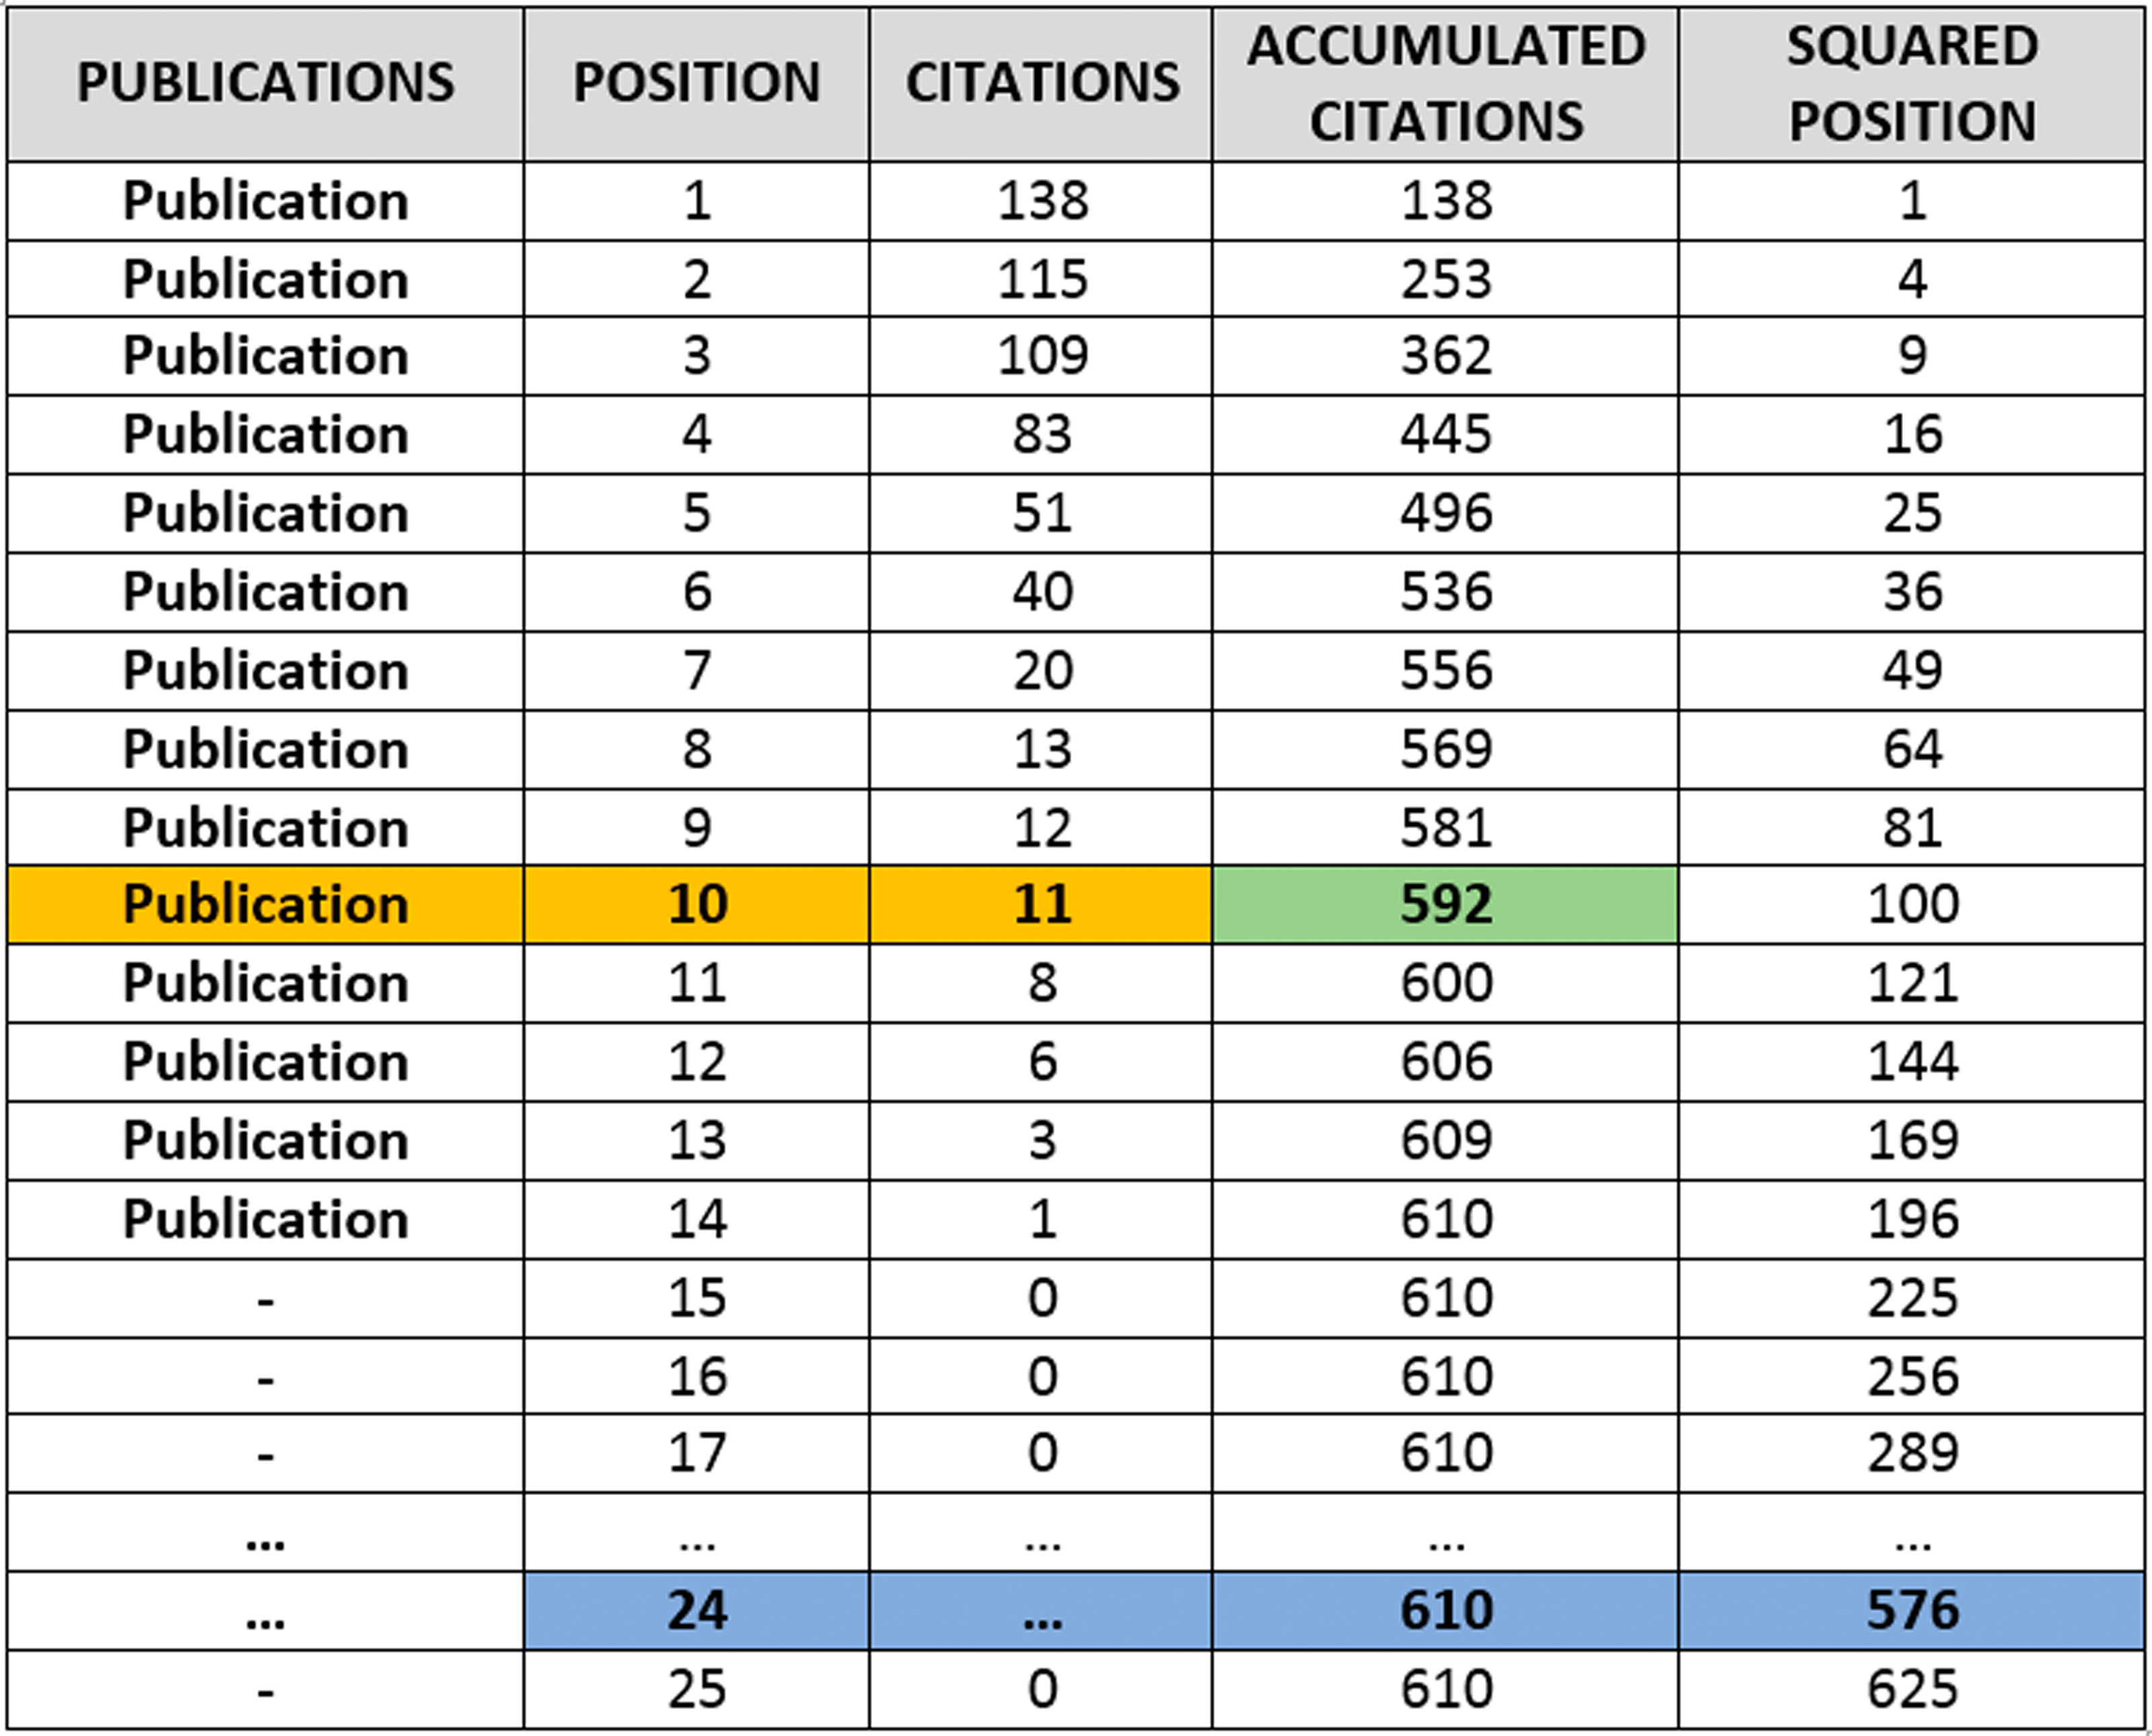
First publication in year 2006.
H INDEX=10
M QUOTIENT=H/10(2016-2006)=1
A INDEX=592 citas/10=59.2
G INDEX=24
H INDEX: Index proposed by Jorge Hirsch (2005) to evaluate the professional quality of scientists, institutions or countries based on the number of citations that received their scientific papers. It measures the number of scientific papers that have been cited at least as many times as that number; in the example, the scientist has a H index = 10, as he published this number of papers that were cited at least 10 times each.
Obviously, the H index has limitations. For instance, once a paper exceeded the minimum number of citations needed to be included in the H index score, the total number of citations are not further considered. Moreover, the H index does not consider the citations of the papers that are not included in the H index score. In the example exposed above (H = 10), the index ignores whether the papers included in the H index core have 11 or 138 citations; neither the citations of the 4 papers that have less than 10 citations. In order to overcome these and other limitations other indices have been proposed. They can be used as an alternative or to complement the H index.
M QUOTIENT: Index proposed by Jorge Hirsch (2005). Obviously, the H index is heavily influenced by time. The M quotient was proposed to compare researchers with different length in their scientific careers. It is simply calculated dividing the H index score by the number of years since the first paper published. In the example, the scientist has an M quotient = 1, since it has an H = 10 index after 10 years since the publication of his/her first article (from 2006 till the end of 2015).
A INDEX: Index proposed by Jin et al (2007). It takes into consideration the number of citations of the papers included within the H index score. The index is defined as the average number of citations of articles included in the H index; in the example, the scientist has an index A = 59.2 (mean = 592/10).
G INDEX: Index proposed by Leo Egghe (2006) aimed to distinguish among authors with similar H indices. Unlike H index, it takes into account the citations of all papers, irrespective of being included in the H index or not. To calculate it, you have to order publications by the number of citations in descending order number them. Then two new columns are created: the first with the cumulative number of citations received and the second with the squared number of the position. The G index corresponds to that last position where the accumulated number of citations is equal to or greater than the number in the column of the squared position; in the example the scientist has a G index=24; since the last position in which the accumulated number of citations exceeds the squared value of the position is 24: 24=610 (>24 squared); accumulated citations in the positions 25=610 (<25 squared).
Using the G and H indices, the GH index (=square root of HxG) and the G/H ratio can be calculated. They try to avoid the big influence that a single publication with many citations may have on the index G.
Dcos INDEX: Deciphering Citations Organized by Subject. Index proposed by Diaz, Cortey and colleagues (2016). The Dcos index uses the H index within an area of study to evaluate the scientific importance of a scientist in that area. As it happens with other indices, it can be applied to evaluate an individual, a group, an institute, a country… However, in this case only the papers in the specific area were evaluated. For instance, if the E. coli H score for pig is 106, the Dcos index for a scientist related to E. coli is the number of publications you have within those 106 papers. The index is complemented by a second figure, which details the number of research fields in which there are publications. Consider a scientist who has two publications in the index H of E. coli and five in Streptococcus suis; the Dcos index for bacteria affecting pigs for that scientist would be 7(2), where 7 is the total number of items included in the H indices cores of bacteria affecting pork, and 2 the number of research fields (pathogens) where he/she has published such papers. Therefore, in the Dcos index, the first figure indicates the number of highly referenced articles within a research field, since they need to be the top cited to be in the H index core; while the second figure marks the scientist’s ability to diversify its research work and successfully address different scientific topics.
LINK TO THE PUBLICATION
Ivan Díaz, Martí Cortey, Àlex Olvera, Joaquim Segalés (2016). Use of H-Index and Other Bibliometric Indicators to Evaluate Research Productivity Outcome on Swine Diseases. PLoS ONE, doi: 10.1371/journal.pone.0149690
OTHER REFERENCES
- Alonso S, Cabrerizo FJ, Herrera-Viedma E, Herrera F (2010). HG-index: A new index to characterize the scientific output of researchers based on the h- and g- indices. Scientometrics 82(2):391-400 doi:10.1007/s11192-009-0047-5.
- Egghe L (2006). Theory and practise of the g-index. Scientometrics 69(1):131-152, doi: 10.1007/s11192-006-0144-7.
- Hirsch JE (2005). An index to quantify an individual’s scientific research output. Proceedings of the National Academy of Sciences 102:16569-16572, doi: 10.1073/pnas.0507655102.
- Jin BH, Liang LM, Rousseau R, Egghe L (2007). The R- and AR-indices: Complementing the h-index. Chinese Science Bulletin 52(6):855-863, doi: 10.1007/s11434-007-0145-9.
For further information, please contact the authors of this post:
Ivan Díaz Luque
IRTA-CReSA Researcher
E-mail: ivan.diaz@irta.cat
Edifici CReSA. Campus de la UAB
Marti Cortey Marques
IRTA-CReSA Researcher
E-mail: marti.cortey@irta.cat
Edificio CReSA. Campus de la UAB